Hi!
Thank you for reaching out, and thank you for the kind words.
To avoid re-inventing the wheel I was hoping to use sct_extract_metric to extract the voxel time series (or even just single values per volume and then loop over volumes) using the MAP method to account for partial volume effects.
It’s definitely possible, but there is no direct way to get the time series as the function is taking only 3D as input. So it would take a bit of simple scripting to get this done. Example below:
First, let’s download an example dataset and have the PAM50 template registered with the fMRI data.
# Download example dataset
sct_download_data -d sct_example_data
# Go inside T2 folder
cd sct_example_data/t2
# Segment spinal cord
sct_deepseg_sc -i t2.nii.gz -c t2 -qc ~/qc-example-fmri
# Label vertebral levels
sct_label_vertebrae -i t2.nii.gz -s t2_seg.nii.gz -c t2 -qc ~/qc-example-fmri
# Register T2 data to template
sct_register_to_template -i t2.nii.gz -s t2_seg.nii.gz -ldisc t2_seg_labeled_discs.nii.gz -qc ~/qc-example-fmri
# Go to fMRI data
cd ../fmri
# Average fMRI data across time. We will use this 3D volume for registration to template.
sct_maths -i fmri.nii.gz -mean t -o fmri_mean.nii.gz
# Register fMRI data to the template (T2*w contrast), using the intermediate template->T2w transformation.
# Note: I am conscious of the poor registration on some slides, which could be mitigated by adding the SC segmentation on the fMRI scan, but this is out of the scope of this example
sct_register_multimodal -i $PATH_SCT/data/PAM50/template/PAM50_t2s.nii.gz -d fmri_mean.nii.gz -dseg t2_seg_reg.nii.gz -initwarp ../t2/warp_template2anat.nii.gz -param step=1,type=im,algo=rigid,metric=cc:step=2,type=im,algo=syn,metric=cc,iter=3,slicewise=0 -qc ~/qc-example-fmri/
# Warp template objects (including the spinal levels)
sct_warp_template -d fmri_mean.nii.gz -w warp_PAM50_t2s2fmri_mean.nii.gz -a 1 -s 1 -qc ~/qc-example-fmri/
Now, let’s split the fMRI data into 3D volume and loop across them to extract the signal in the GM at a specific spinal level:
# Split the fMRI data across time
sct_image -i fmri.nii.gz -split t
# Create a mask of the GM at spinal level C3 by multiplying both probabilistic masks
sct_maths -i label/template/PAM50_gm.nii.gz -mul label/spinal_levels/spinal_level_03.nii.gz -o mask_gm_spinal03.nii.gz
# Loop across individual split fMRI volume and extract signal in the mask using the weighted average method
for file in $FILES; do sct_extract_metric -i $file -f mask_gm_spinal03.nii.gz -perslice 0 -method wa -o gm_spinal03.csv -append 1 -v 0; done
 In this case, the MAP (or ML) methods cannot be used because these assume Gaussian mixture modelling, e.g. each voxel within the mask sums to one across all labels. This condition is not fulfilled when using individual weighted masks. So in that case, I recommend using the weighted average aggregation method (-wa) which also accounts for partial volume effect (although less efficiently than Gaussian mixture modelling methods, but these also make other assumptions so there are pros and cons).
So, the output of the script is a CSV file where each line corresponds to a single fMRI volume, and the weighted average signal in the GM at the spinal level C3 is under the column WA(). See example below (only showing the first 5 lines):
| Filename |
Slice (I->S) |
VertLevel |
Label |
Size [vox] |
WA() |
STD() |
| /Users/julien/sct_example_data/fmri/fmri_T0000.nii.gz |
0:24 |
|
mask_gm_spinal03 |
2.1287050783235500 |
668.5703044494320 |
50.833774317458400 |
| /Users/julien/sct_example_data/fmri/fmri_T0001.nii.gz |
0:24 |
|
mask_gm_spinal03 |
2.1287050783235500 |
663.1901672295030 |
53.625802570546300 |
| /Users/julien/sct_example_data/fmri/fmri_T0002.nii.gz |
0:24 |
|
mask_gm_spinal03 |
2.1287050783235500 |
665.4090632826300 |
54.940635947030000 |
| /Users/julien/sct_example_data/fmri/fmri_T0003.nii.gz |
0:24 |
|
mask_gm_spinal03 |
2.1287050783235500 |
678.9717124154270 |
54.96417477622570 |
| /Users/julien/sct_example_data/fmri/fmri_T0004.nii.gz |
0:24 |
|
mask_gm_spinal03 |
2.1287050783235500 |
664.117924420974 |
53.167289005412700 |
And here is the output CSV: gm_spinal03.csv (10.8 KB)
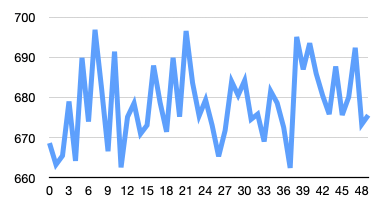
Which you can then use to do this kind of graph:
As an aside the PAM50 spinal level label images, the images, one for each spinal level that contain the probabilities of a given voxel belonging to a given spinal level do not have appreciably high probabilities stored in them. The example figure “Predicting nerve root location” located here: […] and in the SCT toolbox paper etc only displays a maximum probability of 0.2. Am I reading these images/data correctly? Is this just a reflection of the uncertainty/variability of the nerve root locations across people? At a maximum of 20% I would not feel confident claiming any given voxel was at a specific spinal level.
Great question. The probabilistic distribution of each spinal level is normalized such that the area under the curve is equal to one. Given that the variability of spinal level location across individuals is quite large (i.e., large standard deviation of the Gaussian distribution along the S-I axis), each value appears to be small. Also see this user’s question Probabilistic spinal level masks: what is the metric? (sct_warp_template -s)