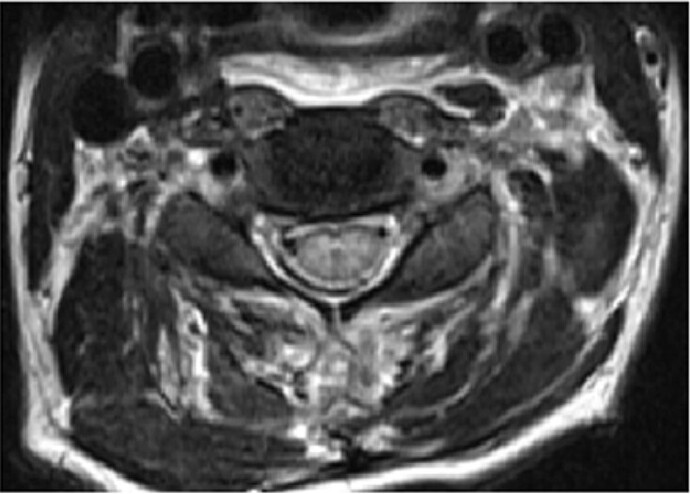
Can SCT measure the area (or %) of left and right corticospinal tract (CST) involvement within the T2 hyper intense lesion in spinal cord injury ie, how much of the CST is within the T2 hyperintense lesion?Thanks
Hi @AdiVeeMiami,
Thank you for reaching out. With SCT, you can register the PAM50 template to your T2 scan. The registration is non-linear and uses both the T2 scan and the cord segmentation. After that registration, you will be able to map all WM tracts onto the T2 scan using the command sct_warp_template, and then quantify T2 signal (incl. hyperintense lesions) using sct_extract_metric. To get started, I encourage you to look at the batch_processing.sh example script, which helps understand the overall processing.
Please note, however, that the warped CST will not exactly correspond to the CST of the subject (which cannot be seen on the T2 MRI), but its location will be predicted from the PAM50 white matter atlas, which is based on the Grays Anatomy atlas.
Related publications:
Thanks for the response.
I used this script: sct_extract_metric -i t2.nii -l 4,5,51,52,53 -perlevel 1 -vert 2:7 -method map
I got my output in a csv file.
A few questions:
-
The column ‘MAP’ - does that represent the t2 signal intensity?
-
Also, thanks for the papers. Is there a script to automatically calculate the WM/GM ratios for different tracts?
3.I see that these papers used T2* imaging due to the good GM/WM contrast. Can I use conventional T2 imaging (not T2* imaging)?
- The column ‘MAP’ - does that represent the t2 signal intensity?
Yes, that represent the “average” T2 signal intensity in the selected region of interest. I’m putting quote/unquote, because this is not exactly the average, but the maximum a posteriori estimation to account for partial volume effect. More details in Levy et al.
- Also, thanks for the papers. Is there a script to automatically calculate the WM/GM ratios for different tracts?
If you compute the signal in the WM and GM separately, you could then use the output CSV file to extract the value and compute the ratio. I made this Python script for you: compute_wmgm_ratio.py (401 Bytes), which you can test with this dummy CSV output: wmgm.csv (466 Bytes):
python compute_wmgm_ratio.py wmgm.csv
# Expected output:
# Ratio is: 0.8784929149954822
Feel free to modify this Python script according to your needs.
And to generate the CSV, you would do something like this:
sct_extract_metric -i t2.nii.gz -l 51,52 -perslice 0 -method map -o wmgm.csv
- I see that these papers used T2* imaging due to the good GM/WM contrast. Can I use conventional T2 imaging (not T2* imaging)?
You can use whatever contrast you want (i.e. SCT is agnostic to the type of contrast), as long as this is justified from a scientific standpoint, e.g. backed up by previous literature, preliminary studies from your group showing that T2 is sensitive to whatever pathology you are interested in, etc.
Thanks a lot for your help!
Hi Julien - I performed the analysis once more to get metrics at C1-C2. However, I find that csv file shows the same number of voxels for WM, GM, CST, etc. This does not make sense since the volume of GM is much less than WM.
My script:
sct_deepseg_sc -i t2.nii.gz -c t2 -ofolder deepseg -qc ~/qc_CCS
sct_label_vertebrae -i t2.nii.gz -s t2_seg.nii.gz -c t2 -qc ~/qc_CCS
sct_label_utils -i t2.nii.gz -create-viewer 3 -o label_c2c3.nii.gz -msg “Click at the posterior tip of C2/C3 inter-vertebral disc”
sct_label_vertebrae -i t2.nii.gz -s t2_seg.nii.gz -c t2 -initlabel label_c2c3.nii.gz -qc ~/qc_CCS
sct_label_utils -i t2_seg_labeled.nii.gz -vert-body 3,9 -o t2_labels_vert.nii.gz
sct_register_to_template -i t2.nii.gz -s t2_seg.nii.gz -ldisc label_c2c3.nii.gz -ref subject -param step=1,type=seg,algo=centermassrot:step=2,type=seg,algo=columnwise -qc ~/qc_CCS
sct_warp_template -d t2.nii.gz -w warp_template2anat.nii.gz -a 1 -qc ~/qc_CCS
sct_extract_metric -i t2.nii.gz -l 4,5,51,52,54,55 -vert 1:2 -method map
sct_extract_metric -i t2.nii.gz -l 4,5,51,52,54,55 -vert 3:6 -method map -append 1extract_metric.csv (991 Bytes)
Indeed, something is wrong. Could you please zip the t2 image as well as the label/ folder and upload it so I can investigate what the problem is?
Here it is- thanks[label copy.zip|attachment](uploat2.nii.gz (1.6 MB) d://8FJIHrhrUVha5e3t4FlkKyQzLJc.zip) (4.0 MB)
@AdiVeeMiami, indeed I am able to reproduce this unexpected behaviour. There is a bug in the report of the value “Size [vox]” when using the “map” method. I’ve opened a ticket here and we will fix this issue soon. Thank you very much for reporting this bug!
Note that in the meantime, you can obtain the correct volume fraction by replacing “map” with “wa”.
Julien - thanks -happy to help improve SCT!
