Hello @jcohenadad!
I have some questions with regards to the voxel sizes and FA values generated for each white matter tract:
- How is voxel data generated, and is it possible to visualize it in cross-section?
- Moreover, some voxel sizes are reported as less than 1. Is this sufficient quality to be able to abstract an FA value from less than one voxel?
- Finally, why is it that the FA value in grey matter appears to be higher than in some of the white matter tracts?
Thank you once again for your help!
Hi,
- How is voxel data generated, and is it possible to visualize it in cross-section?
Could you please elaborate what you mean by “voxel data”? Which SCT function are you referring to? Which output? Could you give an example of output?
Based on your questions below, I suspect you are referring to the CSV output of sct_extract_metric, column Size [vox]. If that’s what you were referring to, then the answer to your question is: this value is generated by counting the number of voxels in the tract of interest (delimited across the specified z slices).
- Moreover, some voxel sizes are reported as less than 1. Is this sufficient quality to be able to abstract an FA value from less than one voxel?
“are reported” where? If you are referring to the CSV output of sct_extract_metric, then a voxel size less than 1 is very small, and likely unreliable. For more details/insights, please see:
- Finally, why is it that the FA value in grey matter appears to be higher than in some of the white matter tracts?
possible reasons:
- noise
- partial volume effect
Best,
Julien
Hi @jcohenadad,
Thank you very much, those were exactly my questions!
With regards to the voxel size <1, could this be due to segmentation/processing errors? Is there a way to visualize each tract in cross-section on the spinal cord?
Best,
Adriana
With regards to the voxel size <1, could this be due to segmentation/processing errors?
yes, could be due to segmentation error, you can check your QC report. But in general, if your resolution is medium and you are looking at small tracts and single slice, it is expected. You should average over higher number of voxels. See details in the articles i posted above.
Is there a way to visualize each tract in cross-section on the spinal cord?
yes, you can use a viewer, e.g. FSLeyes
@jcohenadad thank you!
I cannot seem to find the file that visualizes the tracts in cross-section (perhaps I am not generating it). What is the code for generating this file?
Thanks you!
Hi,
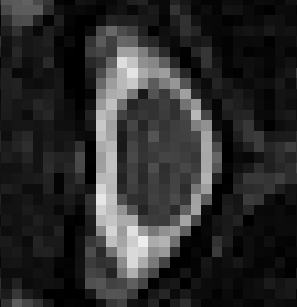
The atlas files are under ./label/atlas. See example of screenshots:
t2:
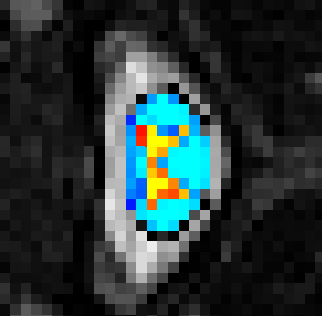
t2 + label/template/PAM50_wm + label/template/PAM50_gm:
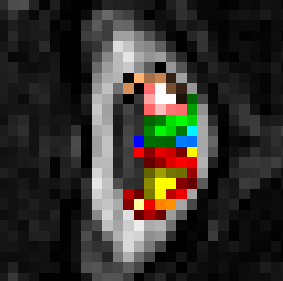
t2+ label/atlas/PAM50_atlas_00 → 09:
Julien
@jcohenadad
Thank you this was very helpful! I have reviewed the qc reports and atlas overlay and it looks appropriate. It appears my image quality may be the problem. I am already averaging FA values over two vertebral levels - would you recommend that I average across more vertebral levels?
it depends on your application, underlying hypotheses (regionwise) and the implications in terms of statistics (e.g. expected effect size, etc)
I see, that makes sense! Thank you @jcohenadad, I really appreciate the helpful advice!
1 Like
@jcohenadad is there a database/report of average voxel sizes per tract that I might be able to compare my values to, as a kind of quality check?
The only reports I am aware of are the publicly-available results from the spine-generic project