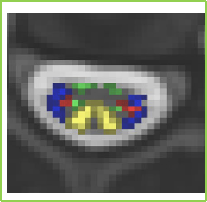
Hello, in a PowerPoint presentation, there is an atlas-based segmentation map, as shown in the figure below.Can you tell me how this graph was generated? This graph is very important to me, and I would be extremely grateful for your help.
Hello,
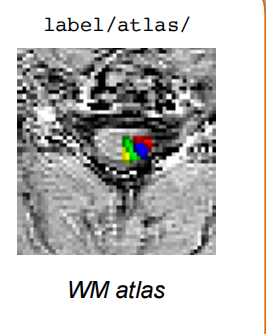
You can find nifti files for individual tracts in your SCT installation folder: $SCT_DIR/data/PAM50. For example, you can open the lateral corticospinal tracts in FSLeyes using the following command:
cd $SCT_DIR/data/PAM50
fsleyes template/PAM50_t2.nii.gz atlas/PAM50_atlas_04.nii.gz -cm red-yellow atlas/PAM50_atlas_05.nii.gz -cm red-yellow
Dear Jan
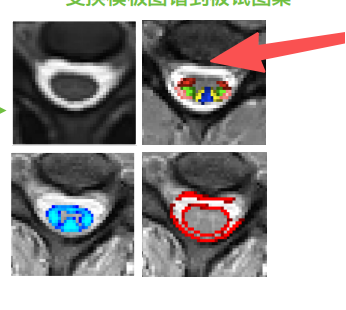
I am so glad to hear from you.I tried it myself and quickly viewed the corresponding segmented pseudo-color image. However, I still have one question. The image currently is a segmented pseudo-color image based on the PAM50 template, as shown in Figure 1. But if I want to obtain segmented pseudo-color images based on dMRI, T2, or MT, as shown in Figure 2, how should I proceed? I would be extremely grateful for your help.
Best
Sunny
To bring the white matter atlas into your single-subject dMRI, T2, or MT space, you first need to register your image(s) to the PAM50 template using sct_register_to_template. Then, you can warp the atlas back to your subject space using sct_warp_template -a 1. Please refer to this tutorial for details.

