This is likely a naive question, but I wanted to know if I could easily extract the anterior-posterior and left-right diameters from the PAM50 template at each segment of the cord (C1-L2)?
Dear @abadgerw123,
You can use the sct_process_segmentation function to compute shape metrics for segmentations (this includes the AP/LR diameters).
In order to compute the metrics on a per-level basis, you can use the command provided in the “Per-Level” page of the “Computing Shape Metrics” tutorial.
# Go into the PAM50 template folder
cd $SCT_DIR/data/PAM50/template
# Compute shape metrics
sct_process_segmentation -i PAM50_cord.nii.gz -vert 1:20 -vertfile PAM50_levels.nii.gz -perlevel 1 -o metrics_perlevel.csv
# -i: The input segmentation.
# -vert: Specify the region (vert level range) that you want to compute metrics over
#        (NB: 1:20 corresponds to C1 to T12)
# -vertfile: Provide a file (separate from the cord segmentation)
#            that contains vertebral level information
# -perlevel: Specify that you want the metrics to be output on a per-level basis
#            (as opposed to aggregated across the entire region of interest)
This will give you an output csv file that contains the following columns:
| Slice (I->S) | VertLevel | MEAN(diameter_AP) | MEAN(diameter_RL) |
|---|---|---|---|
| 80:104 | 20 | 3.73357577428448 | 4.66848188595447 |
| 105:168 | 19 | 5.76845035372785 | 7.44070929434926 |
| 169:231 | 18 | 6.17494682388195 | 7.81882825917149 |
| 232:289 | 17 | 5.88316643256585 | 8.09057379002062 |
| 290:342 | 16 | 5.641114049172 | 8.3869838305823 |
| 343:396 | 15 | 5.57037539504829 | 8.2244087533768 |
| 397:449 | 14 | 5.40397959422134 | 8.26011978063588 |
| 450:500 | 13 | 5.51950350226923 | 7.87796694163388 |
| 501:551 | 12 | 5.45067247790454 | 7.89429867007679 |
| 552:600 | 11 | 5.55794558202091 | 8.36845067976526 |
| 601:646 | 10 | 5.69706170613679 | 8.73255142836116 |
| 647:692 | 9 | 5.73739603784135 | 9.10968157794537 |
| 693:735 | 8 | 5.99351160419758 | 9.39932692957955 |
| 736:769 | 7 | 6.18970169233087 | 10.440457324884 |
| 770:800 | 6 | 6.84605323517412 | 11.8385025384696 |
| 801:833 | 5 | 7.3779034256429 | 12.4001329876539 |
| 834:870 | 4 | 7.39403541769983 | 12.5696997599066 |
| 871:907 | 3 | 7.15689974613588 | 11.8367130007463 |
| 908:938 | 2 | 7.16163192704144 | 11.3276983521367 |
| 939:963 | 1 | 7.20489299894 | 10.6409109947341 |
(Note that the CSV file is ordered from inferior → superior slice, but of course this can be reordered in Excel/Google Sheets/etc.)
Please let us know if you have any other questions. ![]()
Kind regards,
Joshua
One small note: The above command is just is for the unmodified PAM50 template.
If you would like to compute metrics for a PAM50 template that has been registered with subject data, I recommend following the first 3 sections of the “Registration to template” tutorial, which gives an overview of the typical “registration → metric computation” processing pipeline.
Kind regards,
Joshua
Thanks, @joshuacwnewton! This is very helpful!
One question: Can I compute these shape parameters past T12 (ie into the lumbar spinal cord)? In other words, can the vert parameter go beyond the 1:20 in the example you showed?
1 Like
Unfortunately, the spinal cord segmentation contained within the PAM50 template does not extend into the lumbar section:
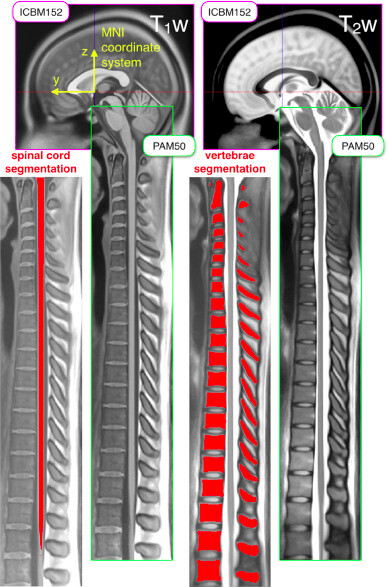
Source: https://www.sciencedirect.com/science/article/pii/S1053811917308686
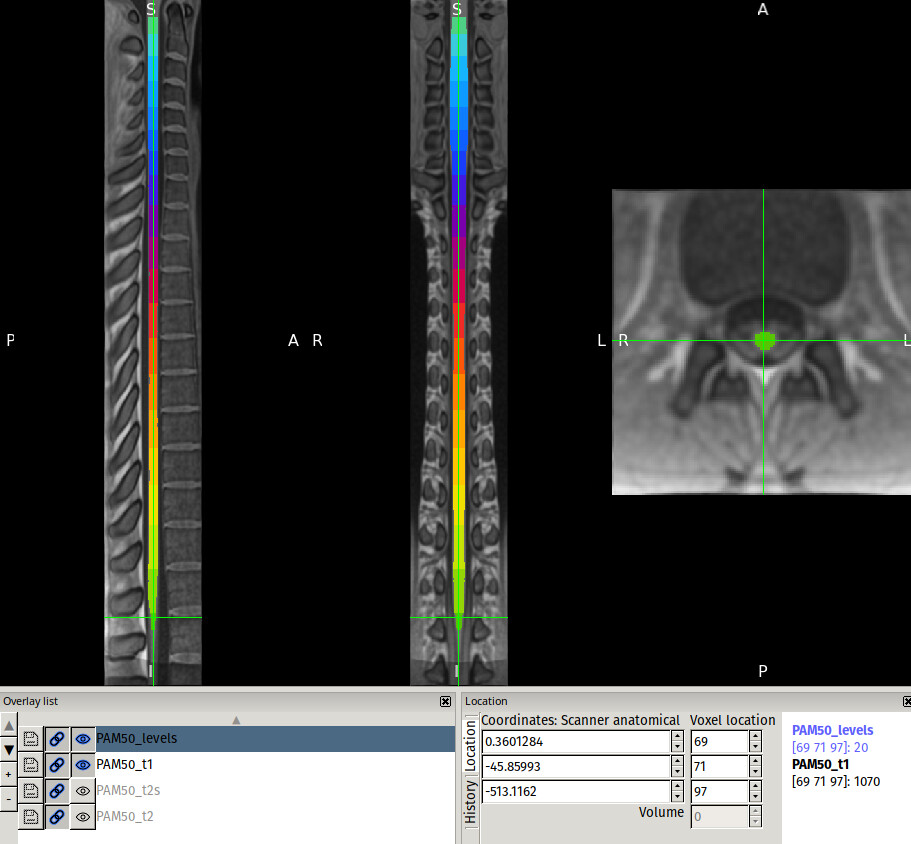
(You can also open the PAM50_levels.nii.gz file in the image viewer of your choice (e.g. fsleyes) to double-check. Here, the labeled cord segmentation stops at label 20.)
Kind regards,
Joshua
Thanks! As background, we have lesions mapped onto paper templates which represent a standard space of the cervical, thoracic, and lumbar regions (attached here for reference):
Cervical.nii (225.3 KB)
Thoracic.nii (281.6 KB)
Lumbar.nii (281.6 KB)
I am hoping to perform distance-based voxel-wise lesion segmentation like this paper: 7 T imaging reveals a gradient in spinal cord lesion distribution in multiple sclerosis | Brain | Oxford Academic
However, in order to do so, I was hoping to have an understanding of the average shape parameters of the cervical, thoracic, and lumbar spinal cord regions. Any thoughts on another way I may get this type of information if the PAM50 stops before the lumbar region?
1 Like
Hi @abadgerw123,
Thank you for reaching out. Joshua already provided excellent information about how to compute shape analysis along the superior-inferior axis. Let me add a few comments.
First off, I understand you wish to compute lesion mapping topography statistics at the cervical, thoracic and lumbar spinal levels. So, while the PAM50 indeed extents to the L2 vertebral levels, the whole lumbar spinal levels are covered by the PAM50 template (since in adults, the cauda equinea starts around L2-L3 vertebrae). So you can use the PAM50 for this analysis.
Now, if you’d like to perform distance-based voxel-wise lesion analysis as in the Ouellette et al. paper, I recommend starting off from the code which was used to process the spinal cord data. If you need any help with that code, please feel free to open an issue.
I hope that helps!
Julien
Thanks, @jcohenadad! This code will be very helpful!
I think I was more referring to something upstream. We hand drew lesion topography onto paper templates (images attached above) from histological images rather than performing spinal cord MRI. Therefore, since we can’t directly compare voxels on our paper template with in-vivo scan voxels due to size differences, I was trying to find a way of equating the bin-widths used in the MRI study with something on our templates to keep things consistent and thought having an understanding of shape parameters at each level (cervical, thoracic, and lumbar) would allow for the calculation of our template voxelsize and hence end up with bin-widths as close as possible to the MRI study? Not sure if there is another way of doing this? I could potentially use size estimates from this paper: https://www.ncbi.nlm.nih.gov/pmc/articles/PMC5179522/#B23
One possibility would be to select a slice in the PAM50 template that corresponds to the matching cervical, thoracic and lumbar levels from your paper template. Then, perform a non-linear registration as illustrated in this image below:
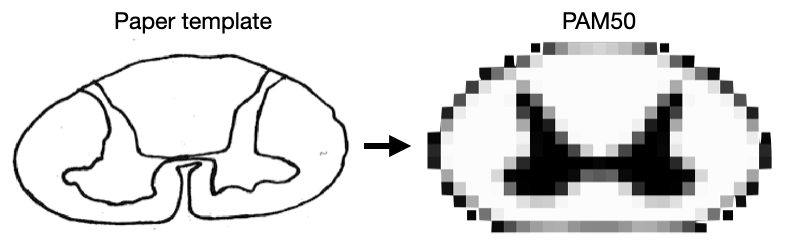
This non-linear registration will produce a transformation, which can then be applied to individual MS lesion mapping (ie: each individual) to bring them from the “Paper space” to the “PAM50 space”. I would be happy to help you find the non-linear registration parameter, as this can be a tricky process.
You could also do the same thing on a higher resolution exvivo template. Unfortunately, this exvivo template only covers the cervical cord, so it might not be suitable for your analysis. First, download the template:
sct_download_data -d exvivo_template
And then perform the slice-wise registration as explained above.
Best,
Julien
1 Like