Problem
When running SCT batch processing (sct_run_batch) in parallel with -jobs 16, it causes the QC .json files of many subjects to be missing from the QC report (index.html). The QC images are generated correctly but the JSON entries for index.html are not written.
I think the cause is that when multiple subjects run in parallel and reach the QC writing step simultaneously, they compete for a file lock (portalocker), sct raises AlreadyLocked and crashes out of the QC step, so the JSON entry is never written for those subjects.
Error message from log: portalocker.exceptions.AlreadyLocked File ".../spinalcordtoolbox/utils/fs.py", line 282, in mutex semaphore.acquire()
I think reducing -jobs to 1 would eliminate this problem entirely, but with each subject taking ~1 hour to process (based on the time documented in the log), 267 subjects would take approximately 11 days to process. And reducing -jobs to a moderate number (4–8) might help, but not solve this problem.
Thank you so much for raising this issue. I am surprised to see that the lock file is resulting in an exception being raised – we adopted that solution specifically to allow multiple processes to run concurrently and wait until the lock becomes available! So, we definitely would consider this a bug, and definitely don’t recommend -jobs 1 as a solution (at least, it shouldn’t be necessary).
I will open an issue on SCT’s GitHub repository and take a look at this as soon as I am able. Hopefully I can come up with a quick solution that allows you to proceed with your analysis in the short-term until we can arrive at a long-term fix.
Thank you for your patience, and thank you for your attention to detail in your report. (I’m about to take a look at your other QC-related post as well!)
Update: It seems the lock is working as intended, but the issue is that we’re running into the 60s timeout built into the lock.
Why we’re running into the timeout I’m not entirely sure (it could be due to the unique combination of -jobs 16 + 267 subjects – perhaps regenerating the HTML file takes a very long time once the number of subjects gets to a certain point, holding onto the lock for longer than anticipated.
This seems like we may need to rethink our structure for parallelism and QC reports. I have some ideas for that. But, in the short-term, it may be fruitful to simply extend the timeout as a quick workaround.
Navigate to L281 (shown above) and change the value from 60 to, say, 600.
Note: We shouldn’t actually need to lock any of the processes for ~10min, but what I’m expecting is that the “real” wait time is actually much smaller (e.g. <10s), and that we’re only exceeding the timeout due to multiple subjects queued up at once (e.g. 6*10s). At most, I expect the wait time to be e.g. 16*10s before all of the subjects begin their 1hr processing time once more.
Of course rather than an increased timeout I expect there to be a more sustainable solution (e.g. writing the JSON entries independently, then triggering a single HTML write at the end of the batch, eliminating the need for a lock entirely). But, this might alleviate the run failures in the short-term.
Thank you for your instructions. Unfortunately, it seems that we are still running into the timeout despite changing it to 600s.
I think we’ll instead try generating the QC reports independently at the end and not in parallel, but would appreciate any other thoughts you may have.
Thank you again,
RD
*** Generating Quality Control (QC) html report ***e[0m
/home/rdpant/software/sct_master/python/envs/venv_sct/lib/python3.10/site-packages/scipy/ndimage/_measurements.py:1548: RuntimeWarning: invalid value encountered in scalar divide
  results = [sum_labels(input * grids[dir].astype(float), labels, index) / normalizer
Traceback (most recent call last):
  File "/home/rdpant/software/sct_master/spinalcordtoolbox/scripts/sct_label_vertebrae.py", line 495, in <module>
    main(sys.argv[1:])
  File "/home/rdpant/software/sct_master/spinalcordtoolbox/scripts/sct_label_vertebrae.py", line 478, in main
    qc2.sct_label_vertebrae(
  File "/home/rdpant/software/sct_master/spinalcordtoolbox/reports/qc2.py", line 746, in sct_label_vertebrae
    with create_qc_entry(
  File "/home/rdpant/software/sct_master/python/envs/venv_sct/lib/python3.10/contextlib.py", line 142, in __exit__
    next(self.gen)
  File "/home/rdpant/software/sct_master/spinalcordtoolbox/reports/qc2.py", line 121, in create_qc_entry
    with mutex(f"sct_qc-{realpath.name}-{md5(str(realpath).encode('utf-8')).hexdigest()}"):
  File "/home/rdpant/software/sct_master/python/envs/venv_sct/lib/python3.10/contextlib.py", line 135, in __enter__
    return next(self.gen)
  File "/home/rdpant/software/sct_master/spinalcordtoolbox/utils/fs.py", line 282, in mutex
    semaphore.acquire()
  File "/home/rdpant/software/sct_master/python/envs/venv_sct/lib/python3.10/site-packages/portalocker/utils.py", line 516, in acquire
    raise exceptions.AlreadyLocked()
portalocker.exceptions.AlreadyLocked
e[0mTotal runtime; 614.534 seconds.e[0m
I think we’ll instead try generating the QC reports independently at the end and not in parallel, but would appreciate any other thoughts you may have.
Yes, this makes sense, I think, at least in the short term.
I will continue to work on this issue on the SCT repository (solving it in the main branch). Once we arrive at a working solution, I will let you know to see if we can patch the issue in your local version.
My deepest apologies for the inconvenience, and I apologies for any time wasted while testing this solution.
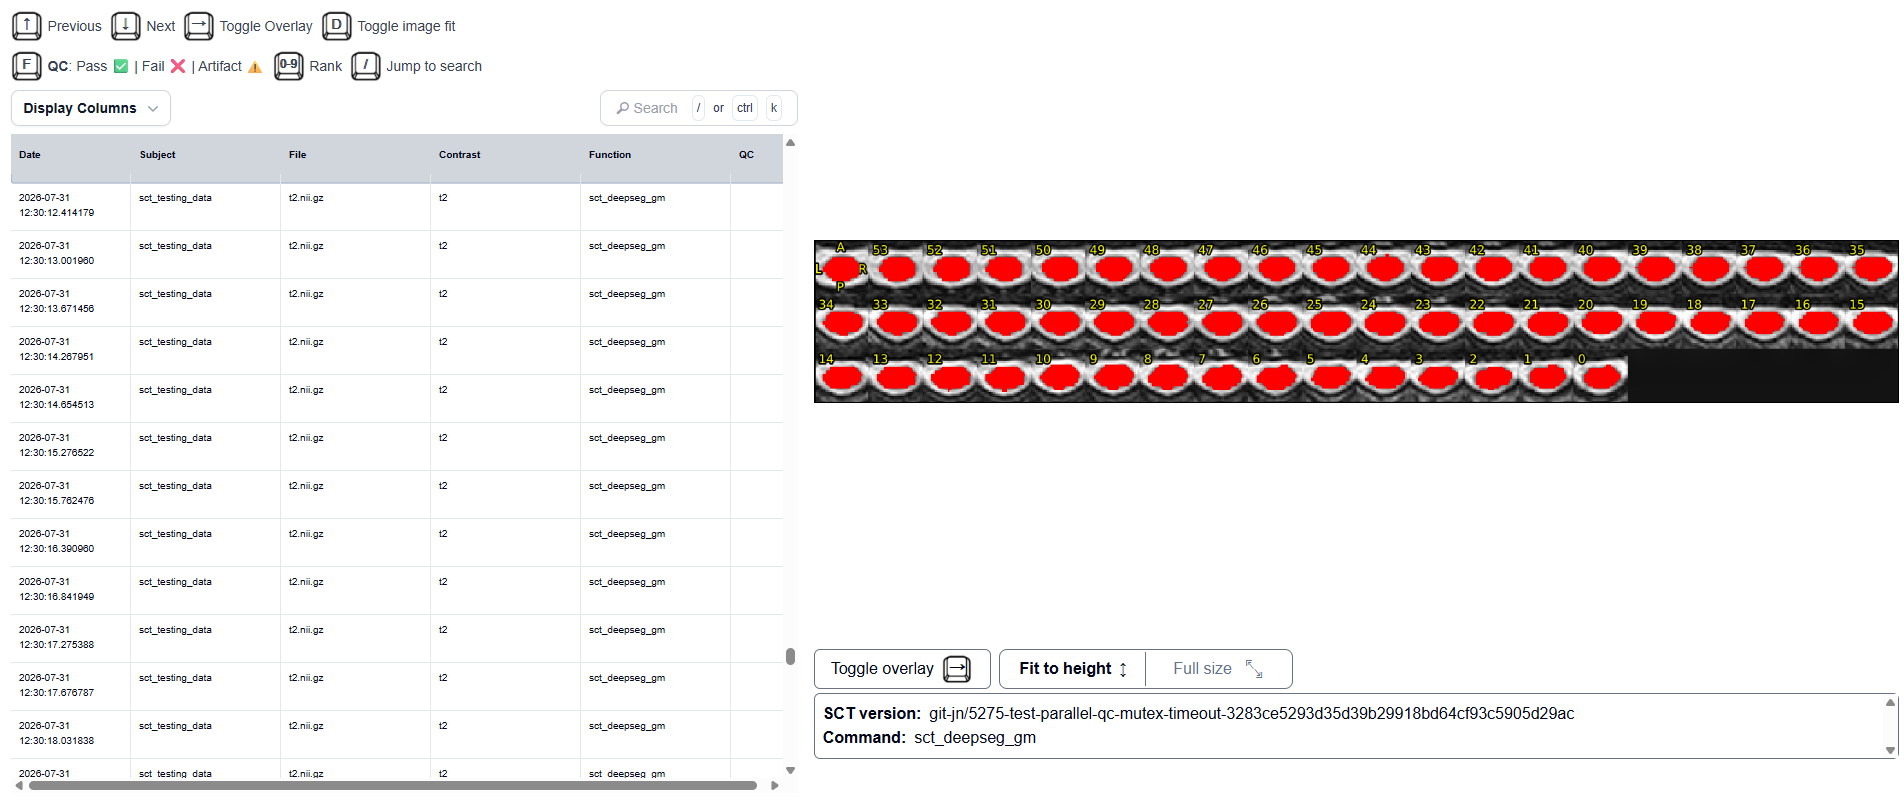
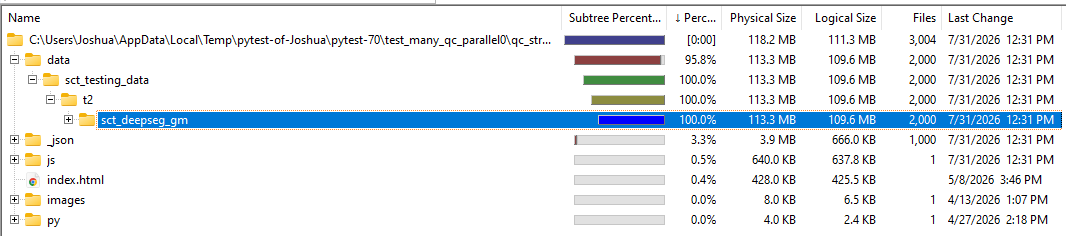
I have been investigating this issue recently, trying my best to reproduce the issue by spawning many jobs across many subjects. But, for a toy report (axial mosaic, small number of slices) I could not reproduce the issue:
And the measurements I took indicated that no one process was waiting anywhere near the 60s (or 600s) timeout.
So, my 2 hypotheses at this point are that:
You are working with significantly larger images that produce larger QC report images with many more slices, and these larger mosaics cause the report to take longer to generate.
You are working with some sort of non-standard filesystem and/or network-attached storage for the dataset.
If possible, could you please run the command sct_image -header -i {YOUR IMAGE} on one of the output images to see its dimensions, resolution, etc.?
Additionally, could you run the command sct_check_dependencies and share any relevant information about your workstation, OS, etc.
Thank you again for your patience. I will continue to try and get to the bottom of this issue for you.
My deepest apologies for the delay. I’ve been running tests in between working on other critical tasks, and I have still been unable to reproduce the issue.
The data header you provided is very nearly identical to one of our testing data files (in terms of resolution, dimensions, etc.), so it was easy for me to rule out that as a potential issue.
I notice that your system information reports 80 CPU cores + 500GB of RAM. This is significantly more powerful than my local laptop environment (8 cores, 48GB of RAM), and so I am wondering if this is by chance a workstation you are accessing over a network, or some sort of cluster.
If you could confirm (possibly by running the following commands as system information), that would be very helpful.
# Define the SCT python path once for reuse
SCT_PY="$SCT_DIR/python/envs/venv_sct/bin/python3"

# Identify TMPDIR filesystem
echo "TMPDIR=$TMPDIR"
"$SCT_PY" -c "import tempfile; print(tempfile.gettempdir())"
findmnt -T "$("$SCT_PY" -c 'import tempfile; print(tempfile.gettempdir())')"

# Check if TMPDIR is shared/NFS or local
df -T "$("$SCT_PY" -c 'import tempfile; print(tempfile.gettempdir())')"

# Confirm portalocker version
"$SCT_PY" -c "import portalocker; print(portalocker.__version__)"
For comparison, this is what I see locally on my machine: