Thoracic spine t2 vertebra labeling

Hello,

I have a t2 MRI image that is centered around the thoracic vertebra and I would like to create a file that has the vertebra labeled so that I can calculate the CSA.

Also I have a t2s MRI image that I would to calculate the CSA of the entire area along with the gray and white matter.

Attached is a file of the commands that I have run, but have been unsuccessful except for creating a segmented t2 image.

Thank you,

Sarah

Hi Sarah,

So, I’ve looked at your images, and I wrote a series of commands to compute CSA at specific vertebral levels:

# Tested with SCT v4.2.1
# Segment the spinal cord
sct_deepseg_sc -i t2.nii.gz -c t2 -qc qc
# Label vertebrae, knowing that the Z=179 axial slice corresponds to the T10-T11 disc (label value "17")
sct_label_vertebrae -i t2.nii.gz -s t2_seg.nii.gz -c t2 -initz 179,17 -qc qc
# Compute CSA at levels T7 to T12 (and average within each level)
sct_process_segmentation -i t2_seg.nii.gz -vertfile t2_seg_labeled.nii.gz -vert 14:19 -perlevel 1 -o CSA_T2w.csv

Here is the QC report: qc.zip (973.6 KB) and the output CSV file: CSA_T2w.csv (3.0 KB) so you will be able to compare on your end.

A few things to note:

  • The FOV is centered at the mid-vertebral body, whereas the feature -initcenter from sct_label_vertebrae only works if a disc (not a mid-level body) is centered in the FOV. Which is why I used the more hand-crafted -initz flag. In the future, if you acquire your subjects by centering the FOV at a disc, you can better automatize the analysis script.
  • Currently, the label value which is entered in the flag -initcenter is shifted by one, due to a bug in the code. A ticket has been opened here. Once the issue is solved, you just have to increase the value by one.
  • It was not possible to segment the gray matter on the t2s image because there is no visible WM/GM contrast on your image. See an example of one slice (most slices are like that):
    Screen Shot 2020-02-24 at 3.31.37 PM

cheers,
julien

Hello Julien,

With regards to the ‘no visible WM/GM contrast’, is there an issue with how the t2 scans (t2 and t2s) were collected? Is there something that can be done to fix this problem?

Sarah

Hi Sarah,
It is known to be very difficult to acquire good-quality images in the thoracic cord, especially for visualizing WM/GM contrast. There are some discussions on that topic in the MRI Acquisition Forum. Please feel free to contribute/comment on the forum.
Best,
Julien

Hello Julien,

I was able to implement the parameters from the text doc you sent me and have new t2s images. Are the images attached better quality to be able to extract gray and white matter? If so what is the best way to extract gray and white matter along with CSA from the image?

Saraht2s.nii.gz (3.1 MB)

Hi,

Yes, it is better, but still not enough for a reliable segmentation. CNR is low (you might want to add averaging). See below, I was only able to automatically segment one slice:

Even with the naked eyes it is difficult to see where the gray matter is. As a rule of thumb: if a human cannot do it, a computer will not be able to :wink:

So, you might want to try the acquisition parameters proposed by [Yiannakas et al. PLOS One 2014].

Hello,

What do you mean you might want to add averaging?

Sarah

Increase your nex (ie repeat acquisition and average in kspace)

Hello Julien,

I have recently scanned someone add increased the nex and it made the images a lot cleaner. Thank you for your suggestions.

For the t2 image I have manually labeled the vertebrae and created a file with those points. When I go to extract the CSA from the t2_seg file I am only given values for that specific point I created not the average from one point to the next. What am I doing wrong? Attached is my code.
batch_processing.sh (2.8 KB)

Sarah

Hi Sarah,

You get a value per point because you’ve inputed labels_vert_1.nii.gz as the vertfile (and this file has effectively a single pixel per level). What you want to do is create a labeled segmentation from your manual points, and then use that labeled segmentation to average per level.

Here is how to do it: batch_processing_20200331-150851.sh (1.9 KB)

Note, I removed the registration to template as it is not required here (it saves you time).

Hi Julien,

Thank you. It worked perfectly. That is exactly what I wanted, a file with labeled segmentation from my manual points.

Is it possible to find the gray and white matter with this file or is it not because you are unable to visibly see the contrast?

Sarah

I believe you have not shared the new file (i.e. with more average) with me so I cannot tell

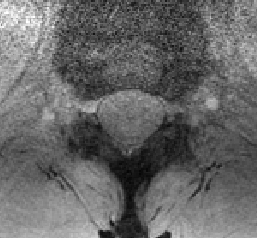
Sorry for not attaching the image to the previous message. Attached is the t2s to determine if gray and white matter CSA can be pulled out.
t2s.nii.gz (3.4 MB)

I am also trying to pull MTR from the below files, but when I get to the point of putting the values into an Excel sheet the values are similar between white matter and the corticospinal tracts.
mt1.nii.gz (1.3 MB)

mt0.nii.gz (1.3 MB)

Get centerline from mt1 data

sct_get_centerline -i mt1.nii.gz -c t2

Create mask

sct_create_mask -i mt1.nii.gz -p centerline,mt1_centerline.nii.gz -size 45mm

Crop data for faster processing

sct_crop_image -i mt1.nii.gz -m mask_mt1.nii.gz -o mt1_crop.nii.gz

Segment spinal cord

sct_deepseg_sc -i mt1_crop.nii.gz -c t2 -qc qc

Register mt0->mt1

sct_register_multimodal -i mt0.nii.gz -d mt1_crop.nii.gz -dseg mt1_crop_seg.nii.gz -param step=1,type=im,algo=rigid,slicewise=1,metric=CC -x spline -qc qc

Register template->mt1

sct_register_multimodal -i $SCT_DIR/data/PAM50/template/PAM50_t2.nii.gz -iseg $SCT_DIR/data/PAM50/template/PAM50_cord.nii.gz -d mt1_crop.nii.gz -dseg mt1_crop_seg.nii.gz -param step=1,type=seg,algo=slicereg,smooth=3:step=2,type=seg,algo=bsplinesyn,slicewise=1,iter=3 -initwarp …/t2/warp_template2anat.nii.gz -initwarpinv …/t2/warp_anat2template.nii.gz

Rename warping fields for clarity

mv warp_PAM50_t22mt1_crop.nii.gz warp_template2mt.nii.gz
mv warp_mt1_crop2PAM50_t2.nii.gz warp_mt2template.nii.gz

Warp template

sct_warp_template -d mt1_crop.nii.gz -w warp_template2mt.nii.gz -qc qc

Compute mtr

sct_compute_mtr -mt0 mt0_reg.nii.gz -mt1 mt1_crop.nii.gz

Extract MTR

sct_extract_metric -i mtr.nii.gz -method map -l 51 -o mtr_in_wm.csv
sct_extract_metric -i mtr.nii.gz -method map -l 52 -o mtr_in_gm.csv
sct_extract_metric -i mtr.nii.gz -method map -l 4 -o mtr_in_left_lateral_corticospinal_tract.csv
sct_extract_metric -i mtr.nii.gz -method map -l 5 -o mtr_in_right_lateral_corticospinal_tract.csv

The corticospinal tract being in the WM, it is not surprising that values would be similar.

Looking at your file t2s.nii.gz, I think the quality is good enough to try the automatic GM segmentation. You can always manually adjust it.

WM takes up a larger region than a specific tract so wouldn’t the sum of all the tracts (within the WM region) equal to the value given for the WM?

That would be a valid argument if you were to compute CSA, but here you are extracting MTR (i.e. take the average metric value) within one region included in another region.

Analogously, if you were to average two pixels of value 5 and 100 pixels of value 5, both averages would be 5.

Oh that makes sense. Thank you

Julien,

I am trying to obtain the GM, WM, and total CSA using the t2s I sent you. Since I am subtracting the GM from the segmented area, the GM CSA values added to the WM CSA values should equal the segmented CSA values. In my Excel output files they do not. I extracted the CSA values for all 14 slices and am including the Excel sheets. The code I am using is below.

Spinal cord segmentation

sct_deepseg_sc -i t2s.nii.gz -c t2s -qc qc

Segment gray matter

sct_deepseg_gm -i t2s.nii.gz -qc qc

Subtract GM segmentation from cord segmentation to obtain WM segmentation

sct_maths -i t2s_seg.nii.gz -sub t2s_gmseg.nii.gz -o t2s_wmseg.nii.gz

Compute cross-sectional area of the gray and white matter between

sct_process_segmentation -i t2s_wmseg.nii.gz -o csa_wm.csv
sct_process_segmentation -i t2s_gmseg.nii.gz -o csa_gm.csv
sct_process_segmentation -i t2s_seg.nii.gz -o csa_total.csv

t2s: t2s.nii.gz (2.3 MB)
csa_gm.csv (4.3 KB)
csa_total.csv (4.5 KB)
csa_wm.csv (4.5 KB)

hi,
a few things:

  • you have some nans in your GM seg, so the summation for these slices will be wrong. Make sure to check your GM segmentation before doing quantification, and manually fix if needed.
  • there is a slice orientation correction going on, which is based on the angle between the slice and the cord centerline. The latter is estimated by fitting a regularized spline to the input segmentation. Given that the input segmentation differs in your three calls to sct_process_segmentation, you might end up with small errors. You can use the flag -angle-corr 0 to turn off angle correction. More info can be found in the SCT course.
  • you are comparing slice-wise values. You should be aware that binary-mask-based quantification of CSA is not precise. If you average CSAs across multiple slices (e.g. vertebral level wise), your precision will be better and the GM+WM vs. SC CSAs will get closer.

In the future, could you please post new questions in a new thread? The title of this thread is “Thoracic spine t2 vertebral labeling”, and this new question does not reflect the title (could be confusing for other users, and for my own organization when trying to catch up with users’ issues). Thank you for your understanding.